
Where is the money? Treasury, position, day summary
How to see where your money is in Nexto: the treasury report, the cash box daybook, the currency position with unrealized profit, and the day summary.
Watch this video on: YouTube
It is the simplest question a money changer asks, and the hardest one to answer honestly: how much money do I have right now, and where is it?
Nexto answers it three ways, each good for a different job. The treasury tells you where the money is sitting. The currency position tells you how much of each currency you hold and at what risk. The day summary tells you what happened today. A fourth report, the monthly one, covers the last twelve months.
It is part of the reports chapter that began with the map of reports and exports, so the filters and exports you learned there work on every page below.
What you will learn
- How to read the treasury report and use it before a payment or at closing time
- How to find the difference when a cash box does not match the notes in the drawer
- How to read the currency position, the average buy rate and the unrealized profit column
- Why exchange offices keep their position in volatile currencies near zero
- What the day summary shows, and how the monthly report gives you the trend
The treasury: where the money is sitting
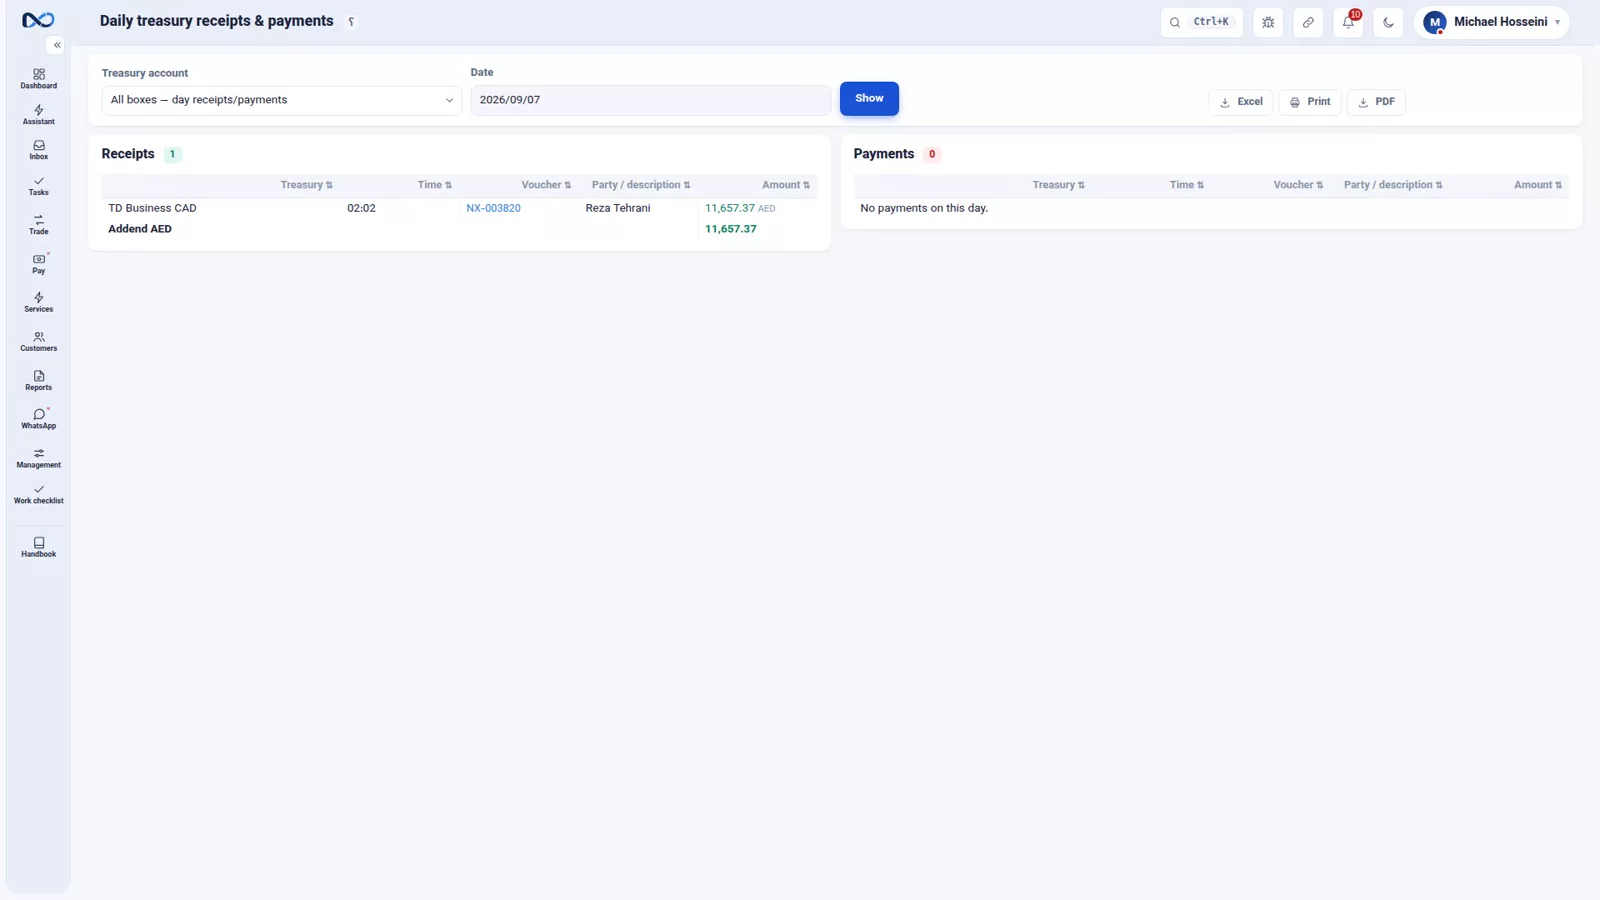
The treasury report is the physical map of your money: every cash box, bank account and digital wallet, with what came into each one today and what left it.
You reach for it in two moments. The first is just before a payment, when you need to know which box or which bank actually has the amount. The second is at closing time, when you count the cash box in Nexto against the notes in the drawer.
When the box does not match the drawer
If the cash box balance in Nexto does not agree with the real notes, do not start recounting the notes. Start from the treasury daybook for that box.
The daybook lists every movement in and out of that one box in time order, with the start-of-day and end-of-day figure for each currency. It carries the same colour reconciliation you met on the customer statement: pick a pen colour, mark the lines you have already checked against the physical money, and the total per colour is computed live. The line still unmarked at the end is the one at fault.
The currency position: what you are holding
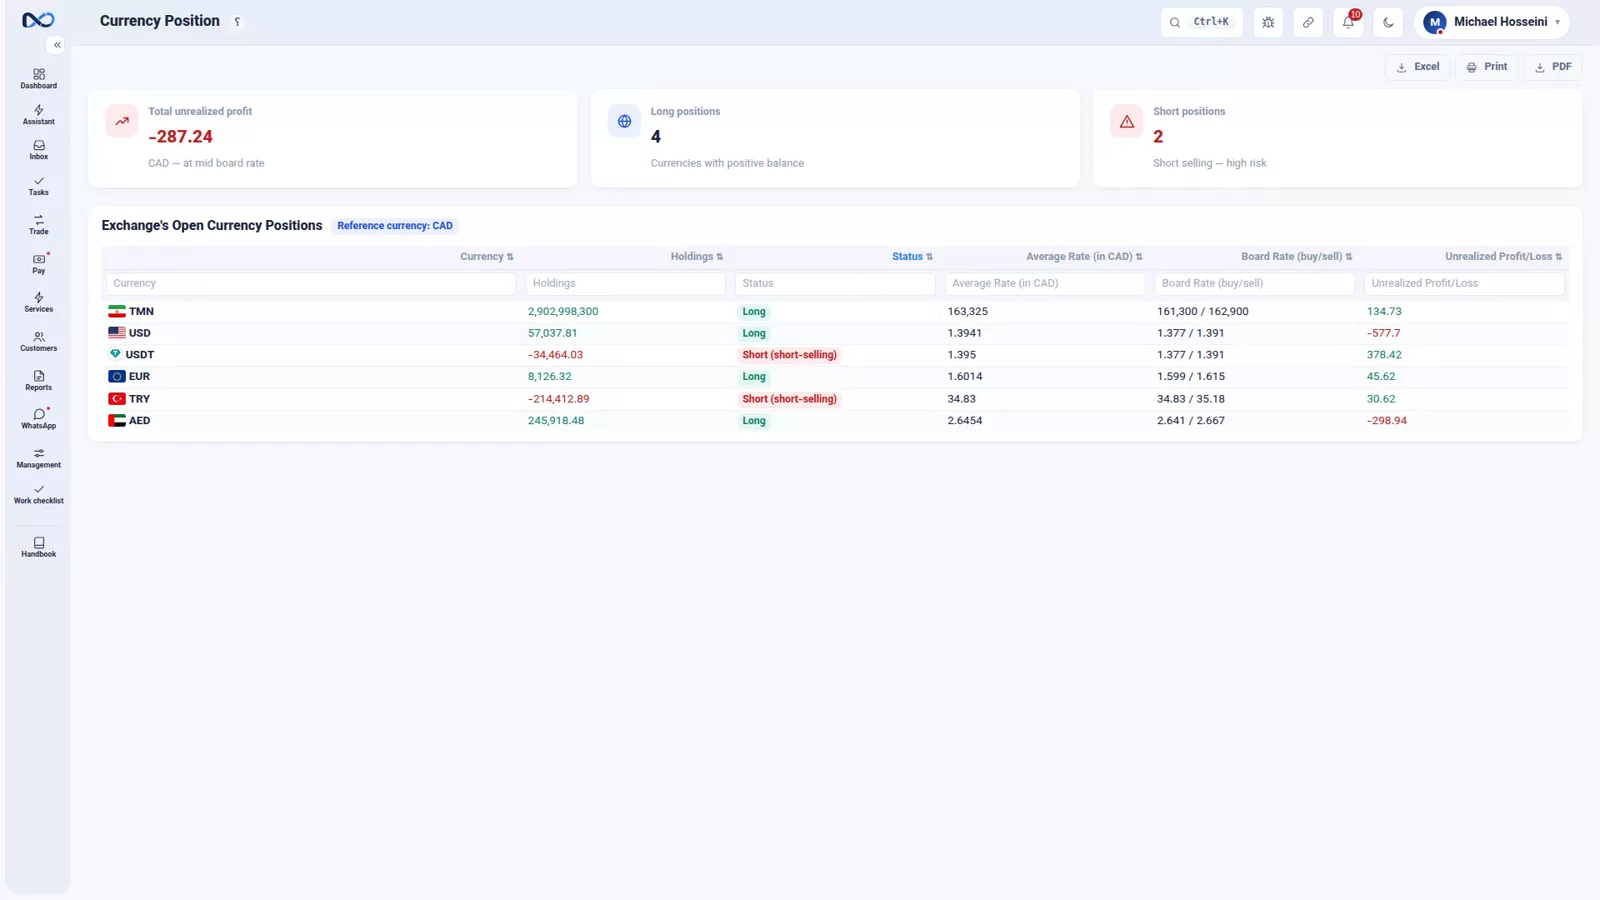
The position report answers a different question. Never mind which box the money is in - how much of each currency do you hold altogether, and at what average rate did you buy it? It is the same position you met in where trade profit comes from.
This is where your risk lives. Currencies like the Iranian Toman and the Turkish Lira move a lot, which is why most money changers keep their position in them near zero: whatever they buy from a customer they sell the same day, so the profit comes from the spread and not from guessing the price.
The unrealized profit column
Say 1 billion Toman is left on your hands overnight and the Toman drops tomorrow. You have lost money without trading at all. The unrealized profit column puts a number on that: what you would gain or lose by closing the position now at today's board rate. The reference currency has nothing of the kind to worry about - in the recordings that is the Canadian Dollar, and everything is measured against it.
The day summary: what happened today
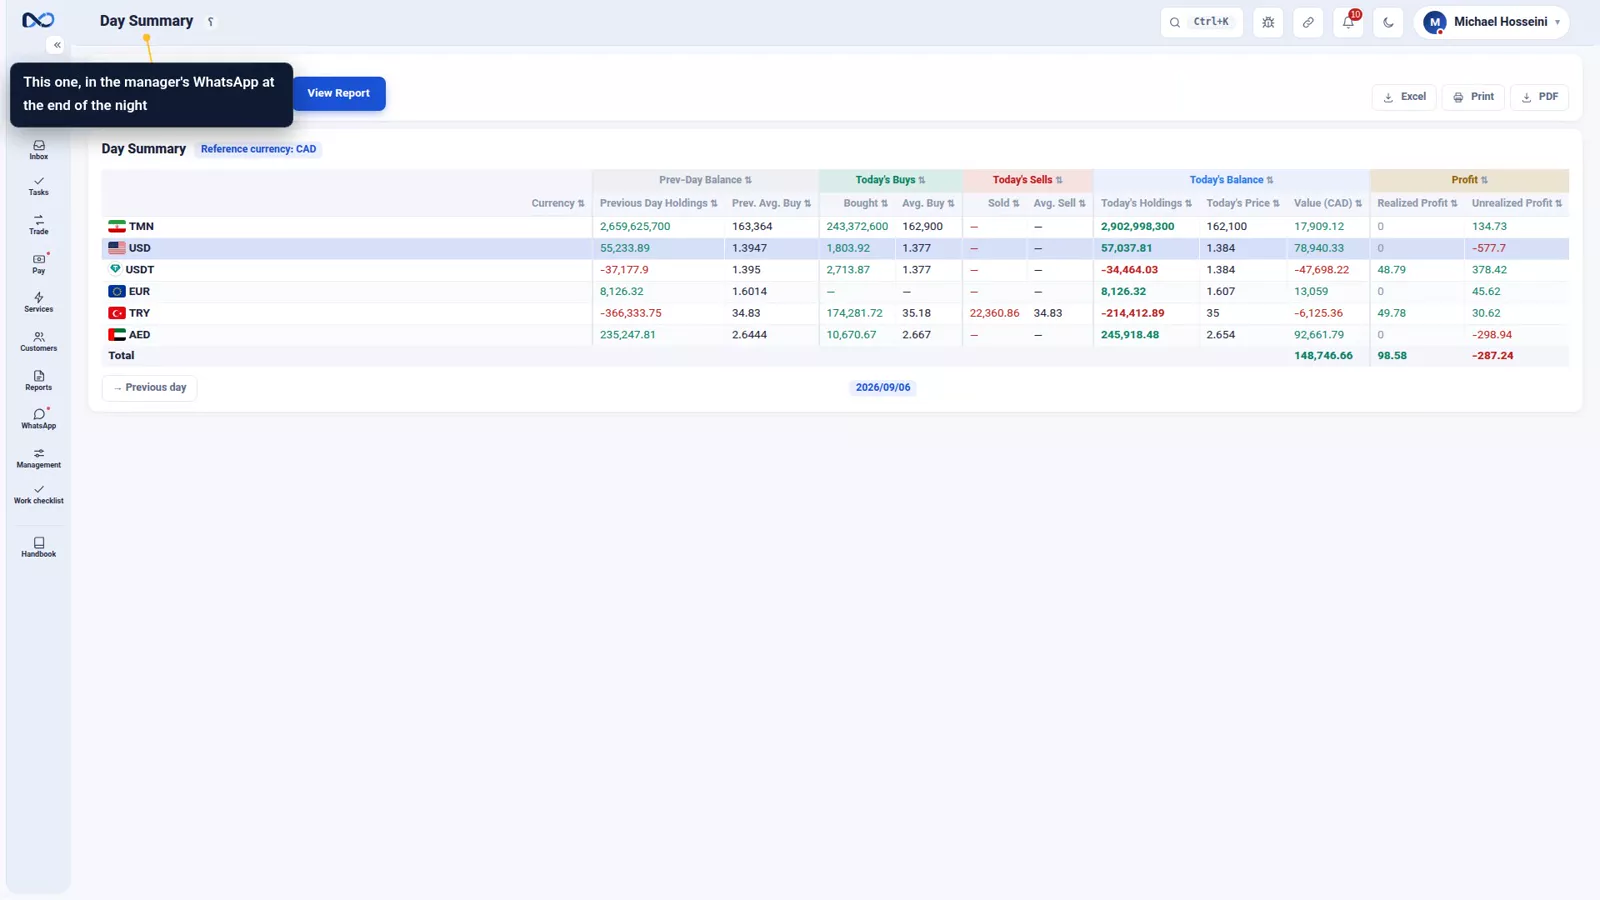
The treasury and the position are photographs of this moment. The day summary is the story of the day: for each currency, the previous day's balance, today's buys and sells, today's balance and the profit of the day.
It is also the report that leaves the office on its own. Switch the nightly report on and this is what arrives on the manager's WhatsApp at the end of the night - the setup is in WhatsApp: groups, templates and the send queue.
The monthly report: the longer view
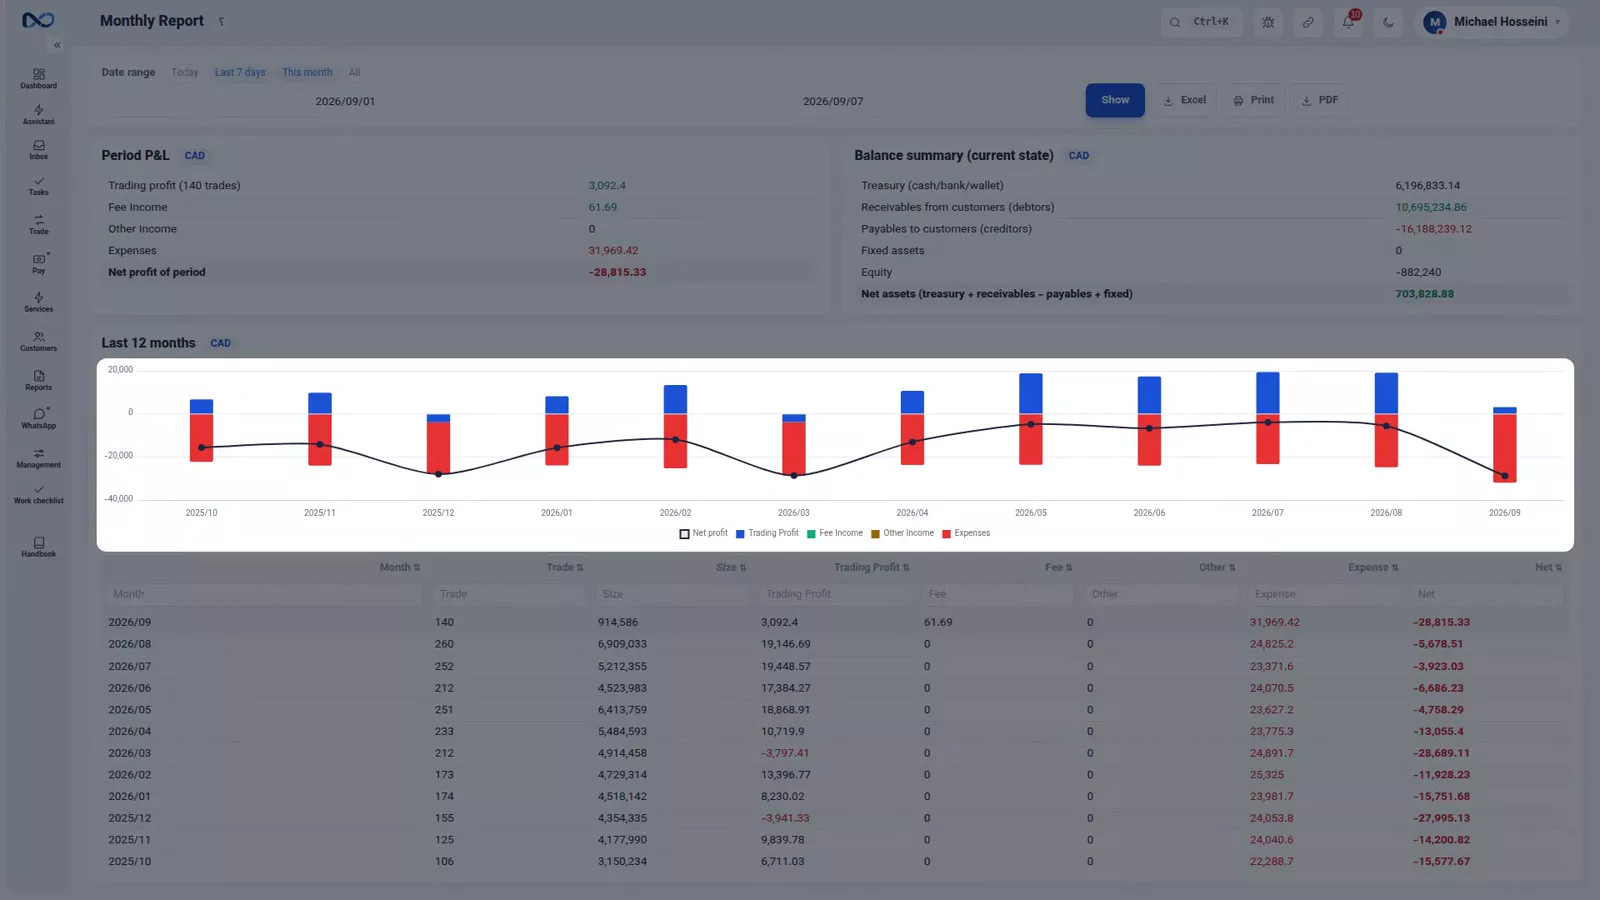
When the question is about the month or the year rather than about right now, open the monthly report. At the top it gives the profit and loss for the range: trading profit, fees, expenses and the net. Beside it sits the balance summary: the treasury, what customers owe you, what you owe customers, fixed assets and equity, which together give your net assets.
Below that is the trend of the last twelve months: per month the number of trades, their size, the trading profit, the expenses and the net, with a chart of the same figures. Read the trend here rather than adding days together by hand.
Tips and warnings
- The treasury and the position are not two versions of one number. One says where the money is sitting, the other says what you are exposed to.
- Reconcile a cash box from its daybook, in time order, instead of recounting the total again and again.
- Unrealized profit moves with the board rate: a warning light, not a booked figure.
- The nightly WhatsApp report only goes out if you switch it on.
Where to go next
The previous episode, the customer statement and the portal, answers this question for one customer rather than the whole office. Next comes who owes you, about money that is yours but not yet in a box. The average rate itself is explained in where trade profit comes from.
FAQ
What is the difference between the treasury and the currency position?
The treasury is the physical map: how much sits in every cash box, bank account and wallet. The currency position ignores location and tells you how much of each currency you hold in total, at what average buy rate, and what closing it today would be worth.
How do I find why a cash box does not match the cash in the drawer?
Open the treasury daybook for that box. It lists every movement in and out in time order with the start-of-day and end-of-day figure per currency, and colour reconciliation lets you mark the lines you have checked until only the problem line is left.
What does the unrealized profit column mean?
It is what you would gain or lose by closing your position in that currency now at today's board rate. Holding a currency is a bet: if a large amount is left on your hands and the rate drops overnight, you lose money without trading.
What is in the day summary?
For each currency: the previous day's balance, today's buys, today's sells, today's balance and the profit of the day. With the nightly report on, the same summary reaches the manager's WhatsApp at the end of the night.
How do I see the last twelve months rather than today?
Use the monthly report: the profit and loss and the balance summary for the range you choose, plus a month-by-month trend of trade count, volume, trading profit, expenses and net.
Full video transcript
The simplest and the hardest question a money changer asks: how much money do I have right now, and where is it? Nexto gives three different answers to that question, and each one is good for a different job: the treasury, the currency position, and the day summary. The first one is the treasury: the daily receipts and payments of every cash box, bank account and digital wallet — what came into each one today and what left it. The physical map of your money.
When do you reach for it? When you are about to make a payment and need to know which box to draw it from, or at the end of the day, when you count the cash box against the notes in the drawer. And if the cash box balance in Nexto doesn't agree with the real notes in the drawer, where do you start? From the treasury daybook: every movement in and out of that box in time order, the start-of-day and end-of-day figure for each currency, and the same colour reconciliation we saw on the statement — you pick a pen, you mark the lines you have already checked, and the total for each colour is computed live.
The second one is the currency position, and it answers a different question: never mind where the money is sitting — how much of each currency do you hold altogether, and at what average rate did you buy it? The same thing we saw in the trade-profit episode. Why does it matter? Because this is where your risk lives. A very common exchange habit: currencies like the Toman and the Turkish Lira move a lot. That is why most money changers try to keep their position in those currencies near zero — whatever they buy from a customer, they sell the same day — so that their profit comes only from the spread and they are not exposed to price moves.
If a billion Toman is left on your hands and tomorrow the Toman drops, you have lost money without trading at all. The currency position shows exactly that: where you stand in each currency, and the unrealized profit column tells you what happens if you close the position right now at today's board rate. The Canadian Dollar, being the reference currency here, has nothing of the sort to worry about. The third one is the day summary. The treasury and the position are photographs of this very moment; the day summary tells you what happened today: for each currency, the previous day's balance, today's buys and sells, today's balance, and the profit of the day.
This is the report that, if you switch the nightly report on, goes to the manager's WhatsApp at the end of the night. And for the longer view, the monthly report. At the top, the profit and loss of the range: trading profit, fees, expenses, net; and beside it the balance summary: the treasury, what customers owe you, what you owe customers, fixed assets and equity, which gives you net assets. Below that, the trend of the last twelve months: for each month the number of trades, the size, the trading profit, expenses and net; the chart shows the same thing.
You read the trend right here, not by adding days together. So, three answers to one question. The treasury tells you where the money is sitting, the currency position tells you how much of each currency you hold and at what risk, the day summary tells you what happened today. And if something doesn't add up, the treasury daybook is where you start.
Try it yourself right now
A complete private demo with sample data — no installation, no credit card.
Create free demo