
The map of reports and exports
How reports work in Nexto: start from the question, use server-side filters and range shortcuts, save My default, and export to Excel or PDF.
Watch this video on: YouTube
Nexto has more than twenty reports, and a list of report names is not a helpful place to start. The way in runs the other direction: start from the question in your head, and let the question pick the report.
Almost everything the owner of an exchange office wants to know fits into four questions. Where is my money? Who owes me? Where did my profit come from? And what exactly have I done with this one customer? The rest of this chapter answers one question per episode, in full.
This episode is the map, not the destination: the reports landing page, and the five things every report in Nexto shares, so that whichever one you open later, nothing on the page feels unfamiliar.
What you will learn
- Which question each report in the chapter is built to answer
- How to find a report by searching the reports landing page instead of remembering its name
- How the date filter and the range shortcuts work, and why they stay fast on a busy exchange
- How to get any report out as Excel, PDF or print with the filter you have on screen
- How to save the filters you always set as "My default"
- How to filter inside a single column, including numeric ranges
Start from the question
The four questions
Before you open anything, name the question. Where is my money? is the treasury, the currency position and the day summary. Who owes me? is debtors, aging and work in progress. Where did my profit come from? is the profit reports. What have I done with this customer? is the customer statement.
The reports landing page
The reports page gathers all of them in one place, grouped by those same questions, each card carrying a short description of what it answers. If you do not yet know what you are looking for, this is where you browse.
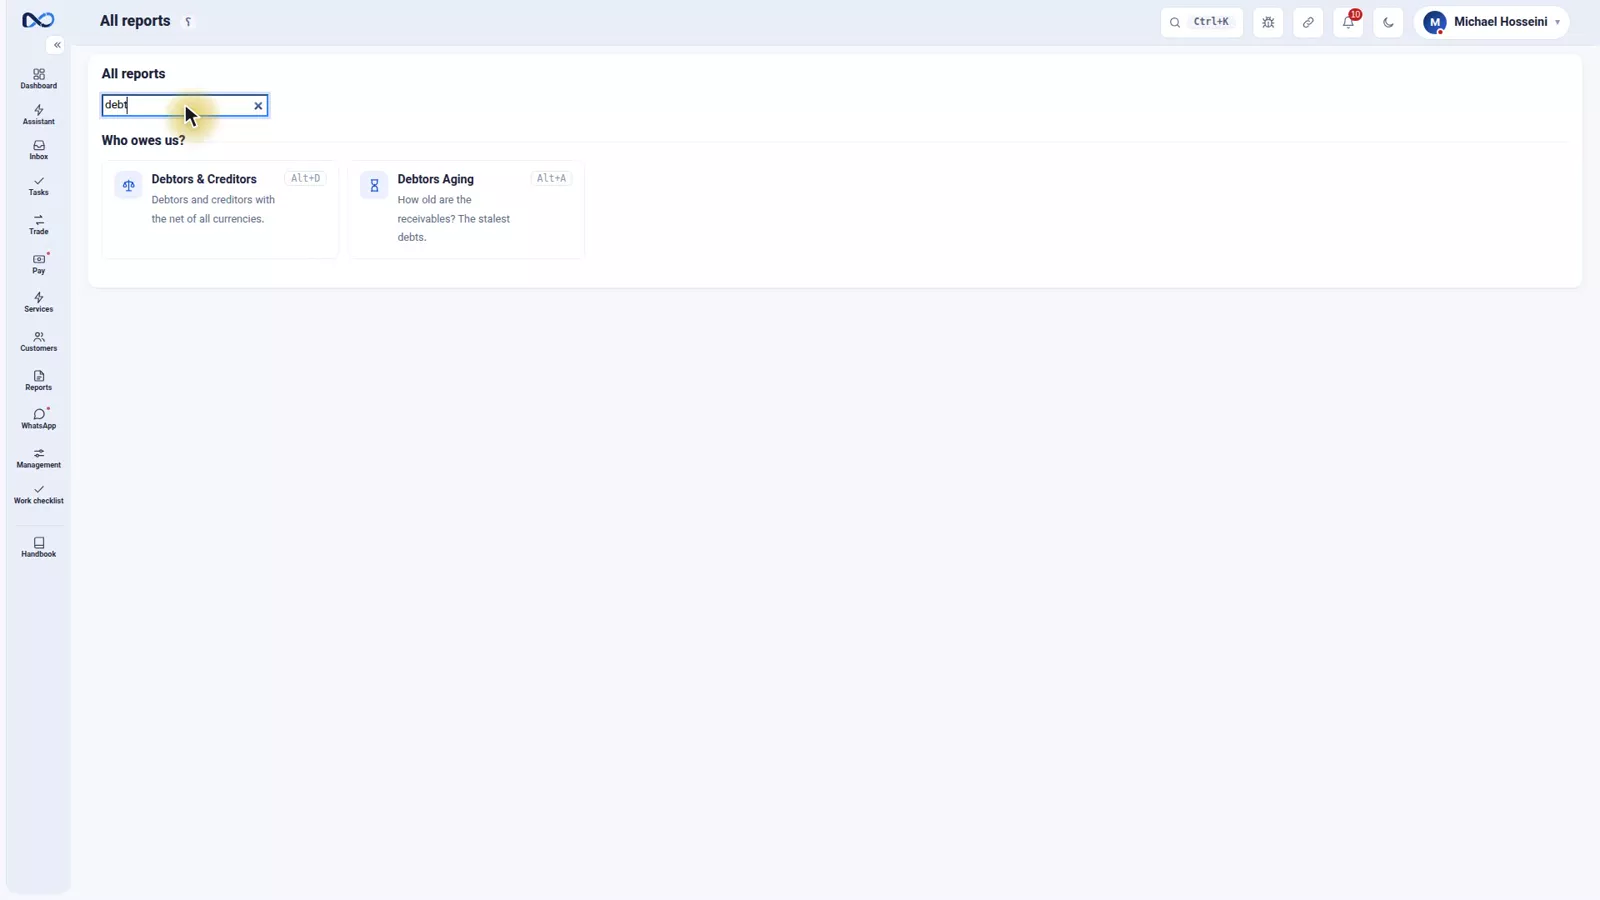
It also has live search: type a word into the search box - "debtors", for example - and the cards filter down as you type.
The five things every report has
Learn these once and every report in Nexto behaves the same way.
1. The filter
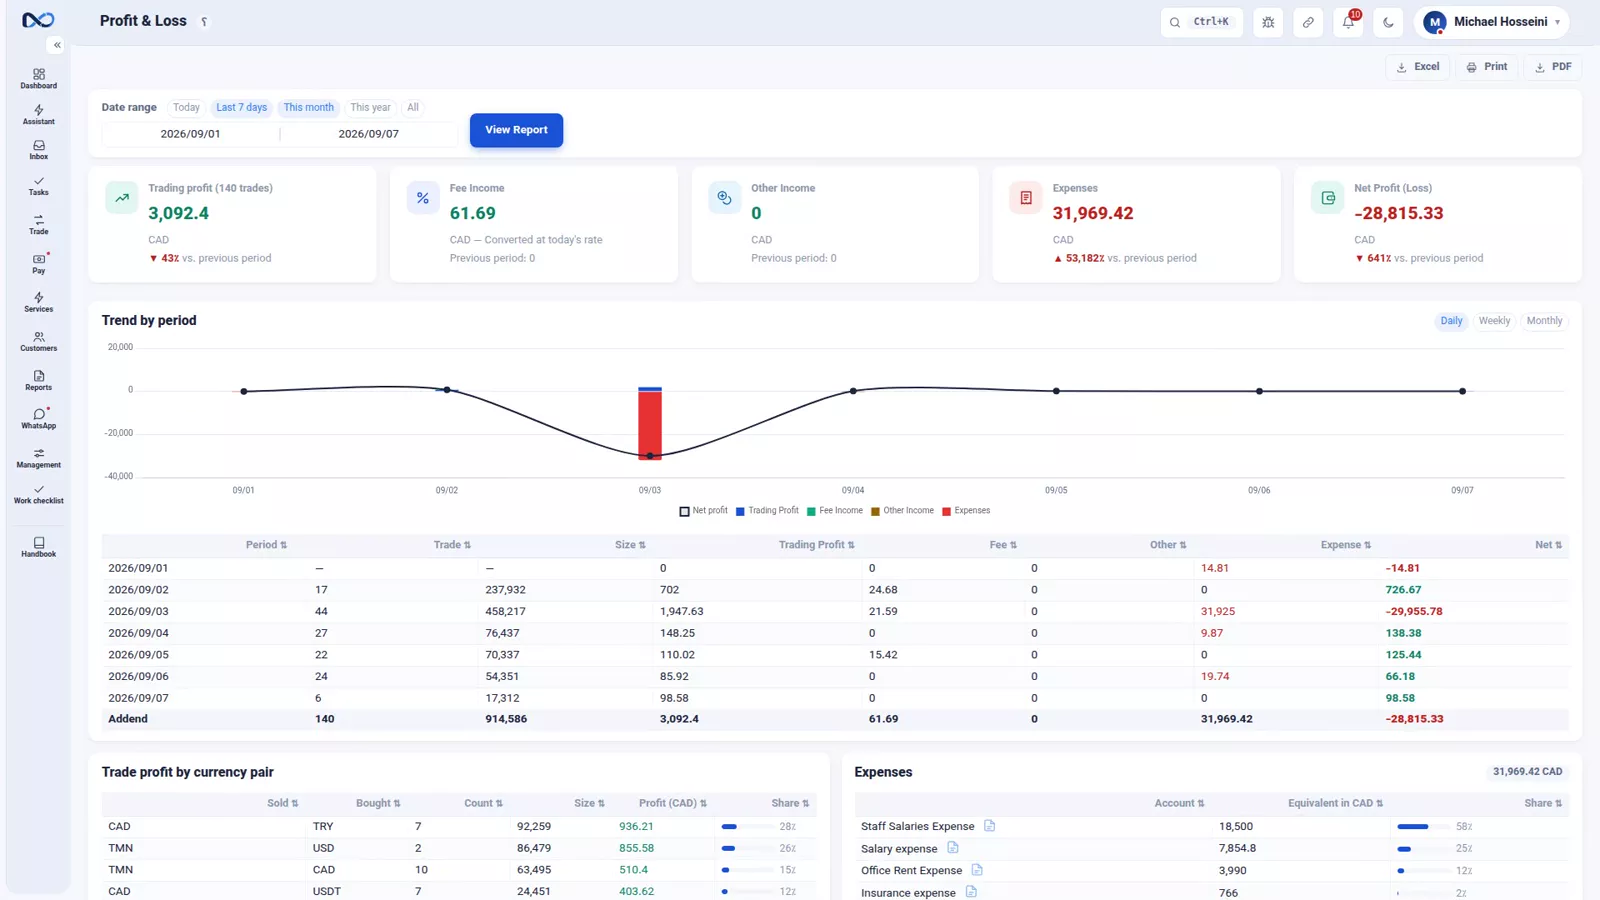
Every report opens with a filter: a from date, a to date, and depending on the report an account or a currency. The filtering happens on the server, not in your browser. That is why the page stays fast on an exchange office with millions of documents behind it - the table you get back is only the rows you asked for.
2. The range shortcuts
Next to the dates sit the range shortcuts: today, last seven days, this month, this year, and all. Nine times out of ten one of them is exactly the range you wanted. Press "this month" and the table refreshes for that range on the spot, on the server, without a page reload.
3. Exports
Every report offers Excel, PDF and print, and all three carry the filter you have on screen. Set the range first, then export. The Excel file arrives in Nexto's own layout, not as a raw dump of the table.
4. My default
If you set the same filters every single time you open a report, set them once and press the "My default" button. From then on that report opens with your filters already applied, for you.
5. The column filters
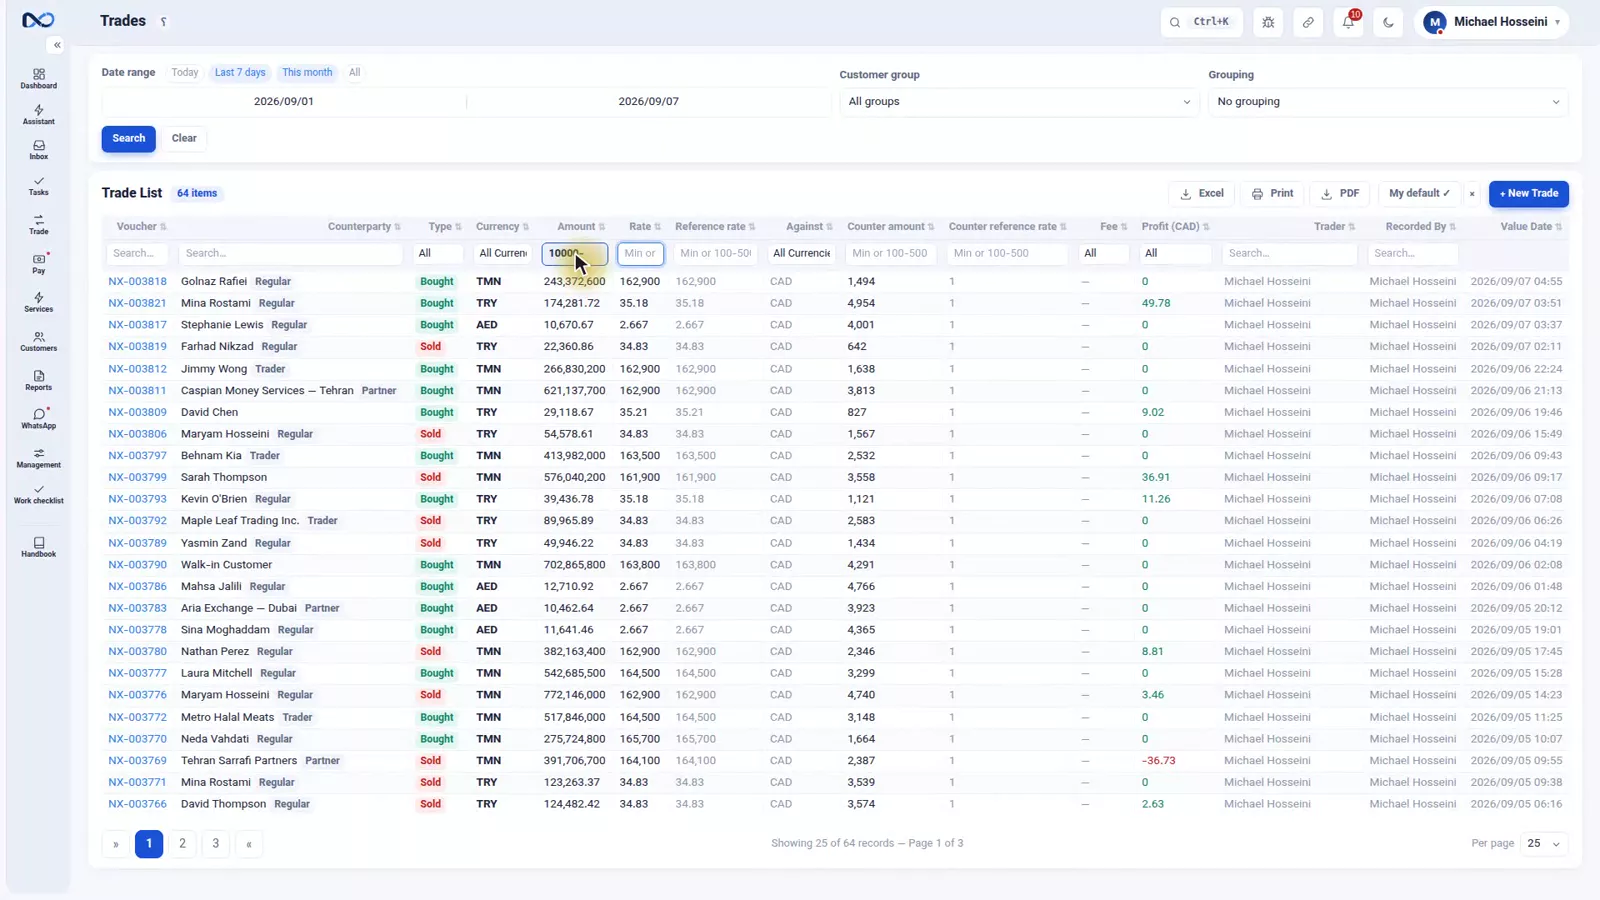
The fifth one is the one people rarely notice. Under the headers of every table there is a row of filters. You can search inside a single column, or give a column a numeric range: to see only amounts above 10,000, type the number, then a dash, and leave the right-hand side empty.
And the page address stays in sync with your filters. Copy the address of a filtered report, send it to a colleague, and they open exactly the view you were looking at.
Tips and warnings
- Do not start from the list of reports. Start from the question - the landing page is grouped that way for a reason.
- Check the active filter before you export. Excel, PDF and print all inherit what is on screen, including a range you set an hour ago.
- "My default" is a convenience for you, not a setting for the office. Treat it as your own starting point, not as the definition of the report.
- A numeric column range with one side left empty is open-ended: everything above a figure, or everything below it.
- The column filter row sits under the headers of every table in Nexto, not only in the reports.
Where to go next
The chapter before this one ends with the AI assistant, which answers questions in words rather than tables. From here the four questions get an episode each: the customer statement and the portal, where is the money, who owes you and where is the profit.
FAQ
How do I find the right report in Nexto?
Start from the question you actually have - where is my money, who owes me, where did my profit come from, what have I done with this customer - and open the reports landing page, where the reports are grouped by those questions. If you half remember a name, type a word into the live search.
Are Nexto reports filtered in the browser or on the server?
On the server. Only the rows matching your filter are sent back, which is what keeps a report fast on an exchange office with millions of documents.
Does the Excel export include my filters?
Yes. Excel, PDF and print all carry the filter on screen at the moment you export, and the Excel file comes in Nexto's own layout rather than as a raw table.
What does the "My default" button do?
It saves the filters you currently have set as your personal starting point for that report. The next time you open the page, those filters are already applied.
Can I filter one column instead of the whole report?
Yes. Every table has a filter row under its headers. You can search text inside one column, or give a numeric column a min-max range - a lower bound followed by a dash, with the upper bound left empty.
Can I send a filtered report to a colleague?
The page address stays in sync with your filters, so copying the address and sending it is enough - your colleague opens the same filtered view you were looking at.
Full video transcript
Nexto has more than twenty reports, and that alone can be confusing. The right way in is not to start from the list of reports — start from the question in your head. Almost everything the owner of an exchange wants to know fits into four questions: where is my money? who owes me? where did my profit come from? and what exactly have I done with a particular customer? The next four episodes each answer one of those questions in full. This episode is the map, not the destination: you learn how every report in Nexto works — the five things they all share — so that whichever one you open later, nothing feels unfamiliar.
This is the reports landing page: all of them in one place, grouped by those same questions, each with a short description. If you don't know what you are looking for, start here. And it has live search: you don't remember the name of a report? Type a word — debtors — and the cards filter on the spot. Every Nexto report shares five things. First, the filter: from date, to date, and depending on the report an account or a currency — and these filters are applied on the server, which means it stays fast even on an exchange with millions of documents.
Second, the range shortcuts: today, last seven days, this month, this year, all. Nine times out of ten, one of those is exactly what you want. This month — and the table refreshes for that range on the spot, on the server, with no reload. Third, exports: every report you see has Excel, PDF and print, carrying the same filter you have on screen. The Excel file comes in Nexto's own layout, not a raw table. Fourth, “My default”: if you set the same filters every single time, set them once and press this button; next time the page opens with them already applied.
Fifth, the one people rarely notice: under the headers of every table there is a row of filters. You search inside that one column, or you give it a numeric range — say only amounts above ten thousand: you type ten thousand, a dash, and leave the rest empty. And the page address stays in sync with your filters; so you copy a filtered report, send it to a colleague, and they see exactly what you see. So the map looks like this: start from the question, get the filter right once and make it your default, filter the columns right there, and export it if you need to.
The next four episodes go after the questions themselves; first: what have I done with this customer.
Try it yourself right now
A complete private demo with sample data — no installation, no credit card.
Create free demo